Elbert Cheng
Program Manager
Keith Ellingwood
Software Engineer
Brian park
Software Engineer
Chris Kim
Software Engineer
Jonathan Trinh
UX Designer
The Team
With our mission in mind, we researched the topic of mobility resources and awareness. Our initial research led to my group discovering the following facts about disability in America:
20% of people live with at least one disability
35% of working-aged people with disabilities are employed
In the US, 1 million live with severe disabilities. 2 million have functional limitations.
Furthermore, when looking into the many societal influences that result in more challenges to be put against the mobility-impaired community, we found that
Enforcement to have or maintain accessibility resources is inconsistent
Attention towards accessibility areas is complex and uneven
Advocacy for mobile-accessibility resources is stigmatized
This leads to our following problem statement…
Problem Context
Problem Statement
What is Mapable?
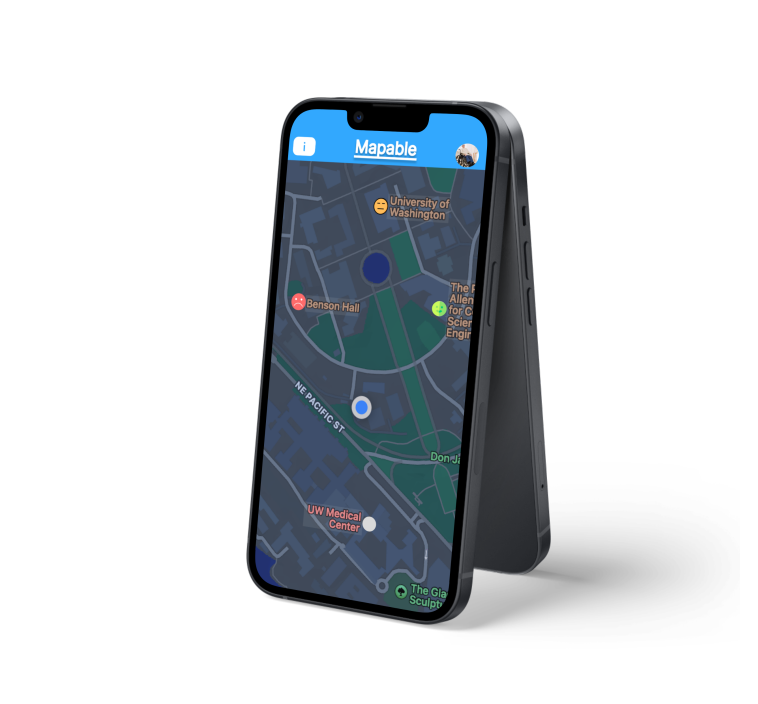
Mapable is a crowd-sourced web browser data tool designed to aid users to find, share, and rate accessibility resources (ramps, elevators, automatic doors, etc) across the University of Washington-Seattle Campus. This project was fueled by sustainable development goal 10: reduce inequalities. We aspired to improve the lives of individuals with mobility impairments by making information about accessible areas easier to access and use.
How might we improve the commute experience of mobility-impaired students and staff of the University of Washington by cultivating accessibility information regarding urban areas?
Research
Literature Review:
Our group primarily engaged in a literature review to further understand the issues related to the problem we chose to tackle. Our understanding of the issue can be found within the American Disability Act’s attention towards accessibility is “complex and uneven” (Pulrang, 2021). According to our research “Enforcement is inconsistent, and advocacy is stigmatized”; “Accessibility complaints and lawsuits are often portrayed as greedy, unfair, or dishonest.” and we “[wait for] periods for businesses that have not yet made necessary accessibility changes” (Pulrang). In addition, it was highlighted how important universal design is, in regards to the ignorant design of an “$41.5 million public library in Long Island City ” where there were inaccessible areas of the building for those who are mobility disabled (Otterman, 2019). it was emphasized how “important is it towards ”allowing everyone to independently enjoy spaces..[and asking someone] else to help you is, at worst, demeaning, and at best, a limiting experience” (Otterman). These sources all lead to the reality of
Lack of reliable information to aid the mobility-disable community
Development of barriers that hinders the lives of many individuals in that community
From our current understanding of the problem, we have deduced a primary cause: A lack of reliable and accessible information on resources and pathways for mobility-disabled people. There is no concrete and updatable source of information that mobility-disabled and wheel-needed individuals can reliably use. Some information may not be available or fully detailed enough to be effectively utilized to create an easy commuting experience. This type of absence and needed information makes it harder to avoid or overcome commuting challenges found within the lives of individuals in mobility-impaired communities. In addition, many businesses do not fully account for the needs of mobility-disabled and wheel-needed individuals, creating barriers for this community that need to be addressed and fixed. According to a Forbes article, “Businesses with barriers today mostly seem to ignore the problem, either out of indifference or a vague sense of guilt and helplessness…Others outsource the problem to architects and consultants … some of whom actually try to improve accessibility, while others apply their skills to more sophisticated forms of avoidance.” (Pulrang). On top of ignoring the problem, they also try to blame others. “Susan Prokop, PVA’s National Advocacy Director, says that newly-opened businesses that receive accessibility complaints will often say, ‘... our building code inspector signed off on this and didn’t say anything about accessibility’” (Pulrang). Through our project, we aim to tackle the issue of businesses and city planners ignoring their responsibility of creating an accessible infrastructure. Using an accessibility-first design, we will start the advocacy for making accessibility a required necessity.
Work Cited
Otterman, S. (2019, November 5). New Library is a $41.5 million masterpiece. but about those stairs. The New York Times. https://www.nytimes.com/2019/11/05/nyregion/long-island-city-library.html
Pulrang, A. (2021, November 21). Why is accessibility still a problem? what can we do about it? Forbes. https://www.forbes.com/sites/andrewpulrang/2019/11/21/why-is-accessibility-stilla-problem-what-can-we-do-about-it/?sh=48a254eef23a
User Cases
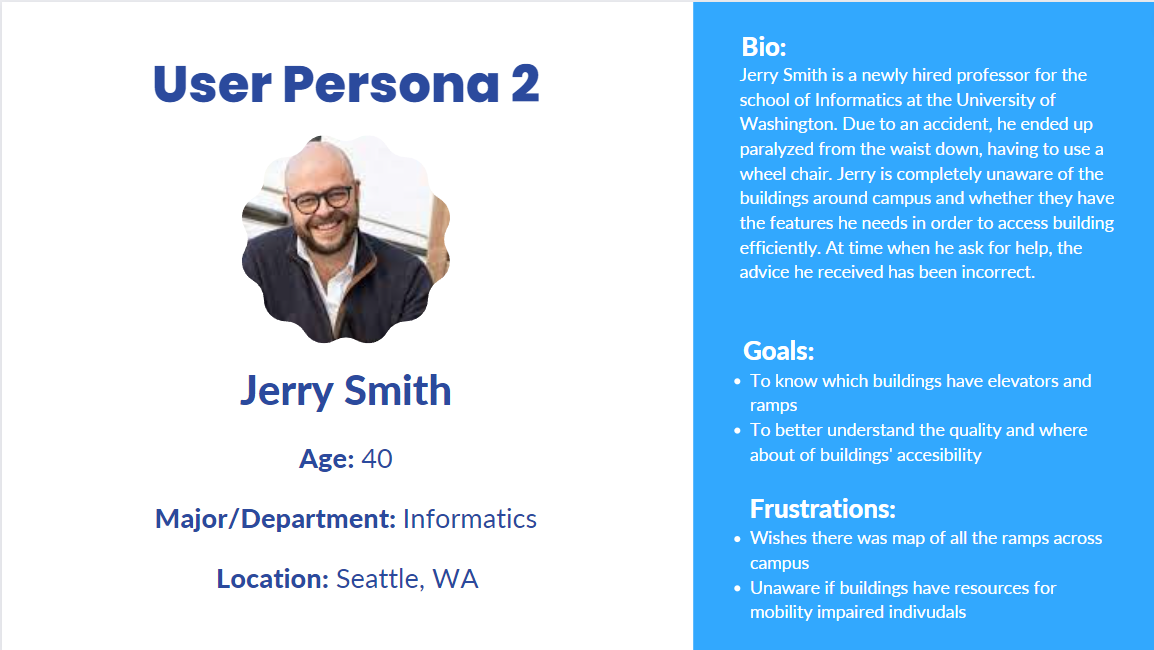
The following user cases help us further think about the mindset of our users, establishing some of the different users might encounter that our product can help solve.
These user cases, along with our research, enabled us to better understand what our intended users needed, learning what are some of the major issues related to our problem in detail, and think about how we can solve those problems with our product. From these insights, we wanted to concentrate on specific design principles and have a clear set of key features to prioritize time management and the successful timely completion of our group’s MVP. We then will dive into the ideation phase and soon have various iterations of our product over the course of 10 weeks
Ideation
During our ideation phase, we had a variety of features in mind, developing a list of our P0, P1, and P2 features. The following features were my group’s top priority (P0s) :
Map
Face Icons
Rating System
Disability Icons
Building Details
We chose to focus on these primary features/components of the product because our group valued accessibility not as something to solve, but as a theme throughout our project. We wanted to provide an abundance of information when users interact with our MVP, prioritizing information to be accessible and to be easily understood when encountered when utilizing the tool. The map reveals to users the locations of accessible areas and resources. The face icons and rating system enables users to gain different visual feedback toward understanding the quality of accessibility resources within an area. The disability icons inform users of what kind of accessibility resources are there within an area. Lastly, the building details contain information regarding that building’s disability resources and overall quality of being an accessible building. From these P0 features, we only were able to incorporate some of our P1 and P2 features. The following list of P1 and P2 features shows what was incorporated into our final MVP (items that are circled are incorporated):
Add images or lack of accessibility
Accessibility Info: Location's name
Accessibility Info: Accessibility type description
Accessibility Info: Picture and description of accessibility
Upload Pictures
User comments for text reviews
Links to more information
Search results lists
API for end users/developers to integrate with other apps
Ability to get: Our crowdsourced building/location info
Ability to get: Our crowdsourced accessibility data
All of the selected feature we tried to incorporate into the iterations of our project in order
Iterations
Ideation 1
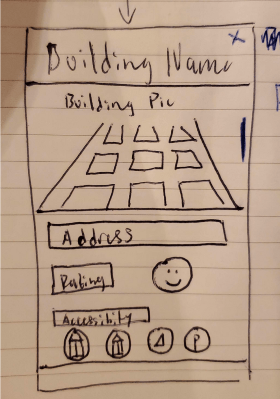
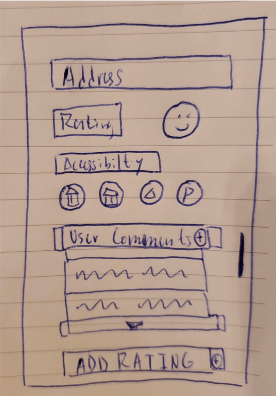
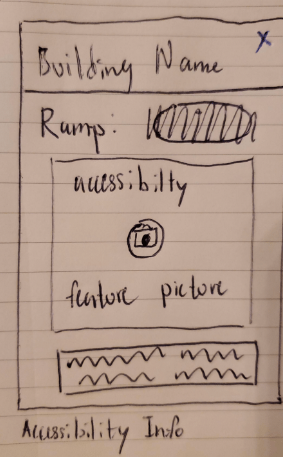
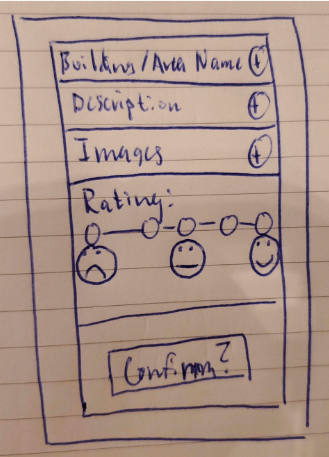
Our first iterations are composed of sketches of wireframes for the essential features we saw at the first stage of the brainstorming phase. We chose to focus on the map home page, building information page, building feature/accessibility resources page. and building rating page wireframes.
Map
Building Detail Part 1
Ideation 2
Ideation 3/MVP
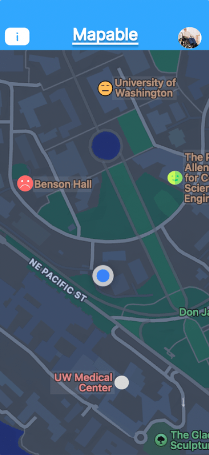
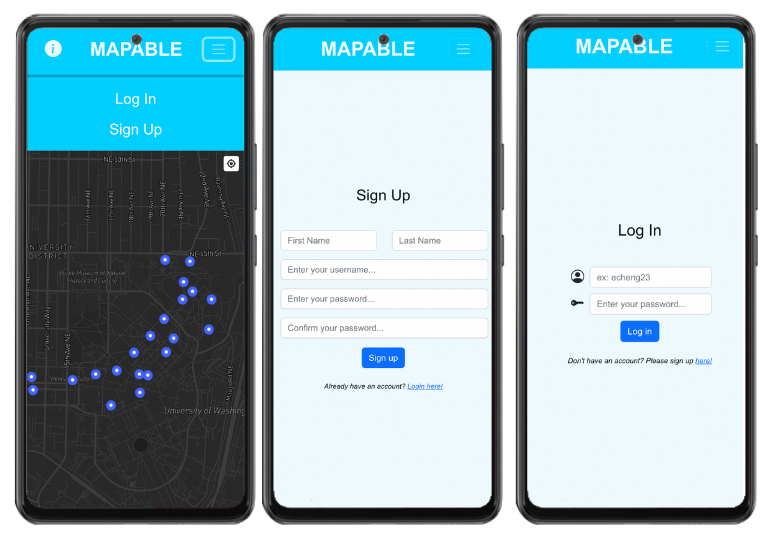
We took our prototype and translated our vision through code and developed a similar MVP that reflected our goal to empower individuals with mobility impairment. For our map, users will see a dot on the screen and will be able to tap on it to pull up a page to look into the building’s information. These building information pages will allow users to see the name of the building, the building’s address, overall rating for the buildings accessibility quality and be able to leave a comment about the building.
Building Detail Part 2
Building Accessibility Resource
Building Rating
Transitioning into the second iteration, we transferred our sketches into a prototype utilizing Figma. We wanted to incorporate different symbols dependent on how zoomed in/out of the map users are. Users can see different face icons to express the overall quality of the building’s accessibility resources when zoomed out. When zoomed in, users can see the locations of individual accessibility resources around a building and be able to navigate to it easily.
Just like the prototype, users will be able to zoom in on the screen and see the accessibility resources within their location. Users can tap on each accessibility icon and can see the image of that accessibility resource and can choose to like or dislike the accessibility resource
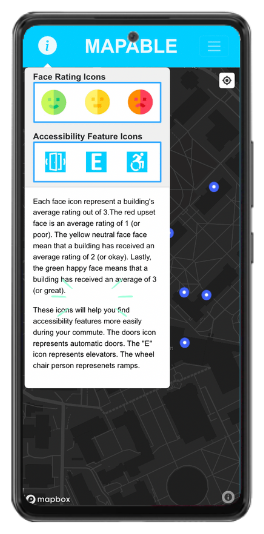
In our MVP we decided to add an information pop-up card feature to the home map page. In order to embrace the idea of accessibility, we added this information to provide clarity regarding what the face icons mean when users encounter the icons on the building information pages. We incorporated a system that would record users and track their ability to leave comments on building rate pages. This would lead to us developing a sign-in/log in page that users would encounter when clicking on the hamburger icon and then choosing to either “sign-up” or “log-in”
Reflection
Moving forward, if the project was to be continued to be developed, we would want to invest in powerful services to help support our projects, such as Google Maps Street View Service, AWS S3 For Persistent Storage, and More Powerful Heroku Tiers. In addition, we would expand our team to add more software developers and include an outreach team. For future plans, we would strengthen the data correlation between features and buildings will build trust in the information gained from the data which can create stronger decisions, collaborate with the UW DRS Office and beta-test the app with stakeholder groups to enhance the practicality of our functionalities, deploy out to our hometown, Seattle, allowing us to gauge how Mapable will fare against the real-world, and work with developers, businesses, cities, and even local governments to push for better accessibility tools, information systems, and actions.
Throughout the development process, I personally pushed myself to be conscious about components, applying micro/atomic design principles when thinking about the iterations users can experience when using Mapable. One main lesson I learned from this experience is that the smallest details in designs cannot be overlooked; I need to think about every component and its usage before finalizing a design. Overall, I believe this project has been primarily successful, allowing us to further dive into the world of product development and understanding how our skillset
